| Back to the main page |
|
Previous Item || Table of Contents What is crosstabulation? A crosstabulation (often abbreviated as crosstab) displays the joint distribution of two or more variables. They are usually presented as a contingency table in a matrix format. Whereas a frequency distribution provides the distribution of one variable, a contingency table describes the distribution of two or more variables simultaneously. Each cell shows the number of respondents that gave a specific combination of responses, that is, each cell contains a single cross tabulation. The following is an example of a contingency table showing the results of two questions: Windows version and subject of contact. The variable "Subject" has five categories: technical support, sales, feature request, bug report, and other. These categories are all inclusive so the columns sum to 100%. The other variable "Windows" has three categories: XP, 2000, and ME. These categories are not all inclusive so the rows need not sum to 100%. Each cell shows the total number of responses and the percentage of subjects that share that combination of traits, along with a diagram representation. 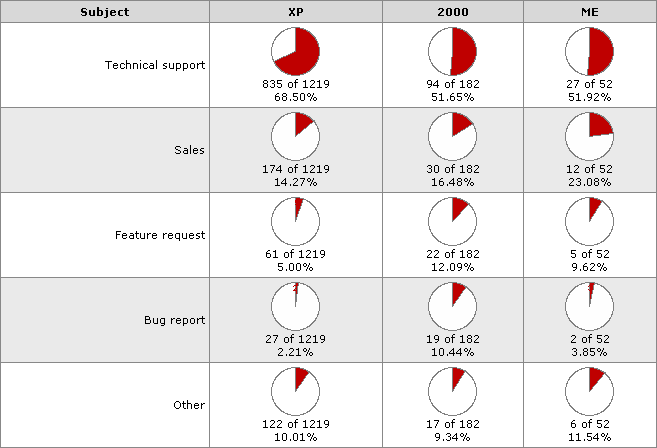 |